中国海洋湖沼学会主办。
文章信息
- 彭松耀, 李新正, 徐勇, 闫嘉, 王洪法, 张宝琳. 2020.
- PENG Song-Yao, LI Xin-Zheng, XU Yong, YAN Jia, WANG Hong-Fa, ZHANG Bao-Lin. 2020.
- 黄海大型底栖动物功能摄食类群的空间格局
- SPATIAL DISTRIBUTION PATTERN OF MACROBENTHOS FEEDING FUNCTIONAL GROUPS IN THE YELLOW SEA
- 海洋与湖沼, 51(3): 456-466
- Oceanologia et Limnologia Sinica, 51(3): 456-466.
- http://dx.doi.org/10.11693/hyhz20191100226
文章历史
-
收稿日期:2019-11-25
收修改稿日期:2020-02-18
2. 中国科学院海洋研究所 青岛 266071;
3. 水利部珠江河口动力学及伴生过程调控重点实验室 广州 510611;
4. 中国科学院大学 北京 100049;
5. 青岛海洋科学与技术试点国家实验室 海洋生物与生物技术功能实验室 青岛 266071
2. Institute of Oceanology, Chinese Academy of Sciences, Qingdao 266071, China;
3. Key Laboratory of the Pearl River Estuarine Dynamics and Associated Process Regulation Ministry of Water Resources, Guangzhou 510611, China;
4. University of Chinese Academy of Sciences, Beijing 100049, China;
5. Laboratory for Marine Biology and Biotechnology, Pilot National Laboratory for Marine Science and Technology(Qingdao), Qingdao 266071, China
黄海是一个大陆架上的半封闭浅海, 面积约38万平方公里, 平均深度44m。黄海海底地形、海流和水团结构都极其复杂, 东南受高温高盐黑潮暖流水的影响, 中北部则有黄海冷水团, 同时受东亚季风的交替作用, 黄海海域生物成分复杂, 生物区系属于北太平洋区东亚亚区和印度-西太平洋区中日亚区, 生物多样性非常高, 生物资源十分丰富, 是我国近海生态系统的重要组成部分, 也一直是周边国家特别是我国开展生命科学和地球科学交叉综合研究的重要区域(苏纪兰等, 2002)。
大型底栖动物是近海生态系统重要的组成部分, 在海洋生态系能量流动和物质循环中有举足轻重的作用(李荣冠, 2003)。大型底栖动物群落组成和结构的变化主要体现在时空格局的变异上(Fraschetti et al, 2005)。海洋地貌、洋流和季风影响大尺度大型底栖动物时空格局(Legendre et al, 1997; Thrush et al, 1997)。环境异质性及生物之间的相互关系影响较小尺度大型底栖动物时空格局(Hall et al, 1994; Turner et al, 1997; Ysebaert et al, 2002)。Underwood等(2000)认为, 在研究生态统系生态动力学过程中加入时空尺度的分析, 有助于了解大型底栖动物分布和演变驱动因素。有关长期环境变化及人类胁迫下生物群落时空分布研究在目前的海洋监测项目中尤为重要(Underwood et al, 2003)。
功能特征体现生态系统整体及结构单元与生态过程的有机联系(Bremner et al, 2006)。Cummins(1974)于20世纪70年代提出功能摄食类群概念, 目前海洋大型底栖动物功能摄食类群分类系统趋于完善, 国外有关大型底栖动物群落功能层面研究较多(Dolbeth et al, 2009; Lavesque et al, 2009; Wijnhoven et al, 2011; Macdonald et al, 2012), 探索沿环境梯度群落功能结构的变化, 同时运用有关功能摄食类群的生态参数准确评估底栖生态环境状况(Weston, 1990)。目前, 我国有关大型底栖动物功能摄食类群报道较多(袁兴中等, 2002; 葛宝明等, 2008; 辛俊宏等, 2011; 李少文等, 2013; 彭松耀等, 2013), 多集中于潮滩、河口等小尺度空间, 有关黄海大型底栖动物功能摄食类群时空分布研究却鲜有报道。鉴于此, 本章研究以2000年10月—2011年8月间的6个航次黄海大型底栖动物为研究对象, 研究黄海大型底栖动物功能摄食类群的时空分布格局, 分析功能摄食类群与环境因子的相互关系, 并运用摄样性指数对黄海底栖生态状况进行初步评价, 旨在为黄海生态系统动力学过程研究提供相关基础资料和数据。
1 材料与方法 1.1 调查区域和时间本研究分别搭乘“北斗号”和“科学三号”科学考察船于2000年10月、2001年3月、2003年6月、2004年1月、2011年4月和8月对黄海大型底栖动物进行调查采样。调查站位的设置见图 1。
 |
| 图 1 6个航次采样站位图 Fig. 1 Sampling sites in the research areas in six cruises from 2000 to 2011 |
各站位使用0.1m2 Gray-O’Hara箱式采泥器重复采样2次, 样品经0.5mm孔径的筛筛选出大型底栖动物, 两次取样获得的样品合并作为该站该次采样样品。样品的现场处理、实验室分析及整理均按照《海洋调查规范》(GB 17378.6-1998)和(GB 12763-2007)的规定进行。2000年10月、2001年3月、2003年6月和2004年1月航次为获取黄海水体及沉积物环境数据。2011年2个航次黄海各站位底层水温、水深和盐度由多功能温盐深仪(Sea bird CTD)现场同步测定。对2011年4月和8月航次于每个样点采集表层5cm沉积物样, 冷冻保存。带回实验室后测定其物理和化学指标, 包括中值粒径、总氮和总有机碳共计三项指标。沉积物中值粒径由法国Cilas 940L激光粒径仪测定。沉积物样品进行40℃恒温烘干前处理, 然后使用美国Perkin-Elmer 2400元素分析仪测定沉积物总氮和有机碳。
1.3 功能摄食类群的划分本文大型底栖动物功能摄食类群的划分主要参考Pearson(1971)、Fauchald等(1979)、Gaston(1987)、Sanchez-Mata等(1993)和朱晓君等(2003)的研究, 根据上述研究结果大型底栖动物被划分为植食者、滤食者、食底泥者、食碎屑者、肉食者和杂食者等6个功能摄食类群。
1.4 数据分析黄海底栖生态健康状况评价运用Shannon- Wiener指数(H′FD)、Pielou指数(J′FD)。计算公式见表 1。摄食多样性指数评估值及阈值范围见表 2。
| H′FD指数计算公式 | J′FD指数计算公式 |
 |
 |
| 注: Pi为第i种功能摄食类群的个体数与样品中的总个数的比值; S为功能摄食类群数 | |
| J′FD指数 | 底栖群落健康 | 站位扰动等级 | 生态质量状况 |
| 0.8—1 | 常态的 | 无扰动 | 高等的 |
| 0.6—0.8 | 虚弱的 | ||
| 不稳定的 | 轻度扰动 | 优良的 | |
| 0.4—0.6 | 向污染过渡的 | 中度扰动 | 中等的 |
| 0.2—0.4 | 被污染的 | 不健康的 | |
| 向重度污染过渡的 | 重度扰动 | ||
| 0.2以下 | 重度污染的 | 极不健康的 | |
| 无生命的 | 极端扰动 |
排序分析将大型底栖动物功能摄食类群与环境因子进行耦合分析, 本研究主要运用冗余分析(Redundancy Analysis)。分析前将功能群丰度数据进行平方根转化, 环境数据进行log(x+1)转化, 运用方差膨胀因子分析(variance inflation factor), 筛选出对底栖功能摄食类群影响显著的环境因子。以上分析运用基于R语言程序(R version 3.5.0)的“Vegan”包进行运算。
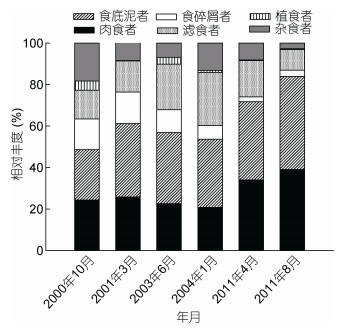
2 结果 2.1 大型底栖动物功能摄食类群相对丰度2000年10月—2011年8月期间的航次, 黄海大型底栖动物功能摄食类群相对丰度见图 2。结果表明, 黄海大型底栖动物相对丰度较高的功能摄食类群为肉食者、食底泥者和滤食者。黄海大型底栖动物食底泥者和肉食者相对丰度高值出现在2011年8月航次, 分别为44.88%和39.04%, 滤食者相对丰度最高出现在2004年1月航次, 为25.55%。
 |
| 图 2 6个航次黄海大型底栖动物功能摄食类群 Fig. 2 Relative abundance of functional feeding groups of macrobenthos in the Yellow Sea from 2000 to 2011 |
黄海大型底栖动物功能摄食类群的空间分布见图 3。由图 3可知, 黄海大型底栖动物肉食者主要分布在黄海冷水团边缘靠近海州湾东侧; 食底泥者主要分布在黄海近岸及黄海冷水团边缘; 滤食者主要分布在黄海冷水团中央区域。
 |
| 图 3 6个航次黄海大型底栖动物功能摄食类群空间分布 Fig. 3 The spatial distribution patterns of 3 feeding functional groups in six cruises |
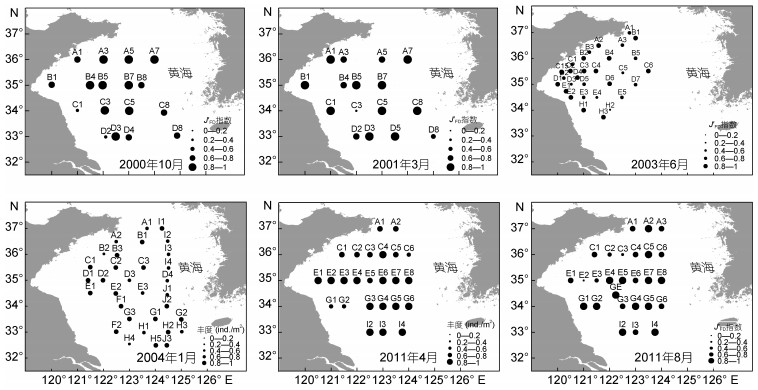
2000年10月航次大型底栖动物摄食多样性指数的低值(0.2—0.4)主要分布在近苏北浅滩(C1和D1站) (图 4)。2001年6月航次C3站未采集到标本, 大型底栖动物摄食多样性指数为0, 黄海冷水团东南边界D8站摄食多样性指数为0.59, 其他站位的摄食多样性指数均在0.6以上。2003年6月航次近黄海冷水团西南侧边界区域的H2站和E4站摄食多样性性指数值分别为0.2和0.47。2004年近黄海冷水团西南侧边界区域的H4站摄食多样性指数较低, 为0.4。2011年4月航次近苏北浅滩的G1和G2站摄食多样性指数值较低, 分别为0.46和0.59。2011年8月航次近黄海冷水团的西部边界的C3和E2站摄食多样性指数值较低, 分别为0.23和0.14。
 |
| 图 4 6个航次大型底栖动物摄食多样性指数J′FD空间分布 Fig. 4 Spatial distribution patterns of values of J′FD in different stations in 6 cruises |
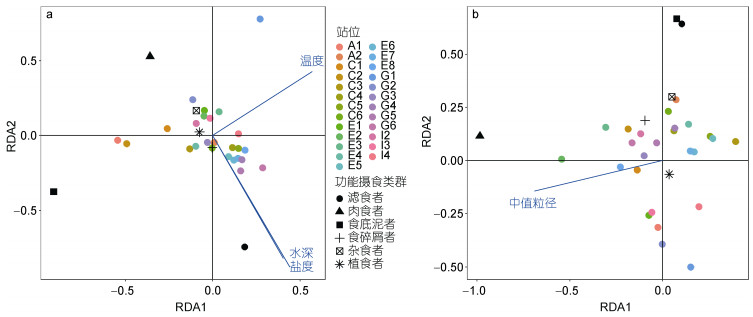
对研究海域大型底栖动物功能摄食类群与环境因子进行耦合分析, 根据2011年4月和8月航次大型底栖动物及环境数据, 选取水温、水深、盐度、沉积物总氮、沉积物总有机碳和中值粒径等6个环境因子与大型底栖动物功能摄食类群丰度数据进行冗余分析(图 5), 并筛选主要影响因子。结果表明, 2011年4月底层水的盐度、温度和水深与黄海大型底栖动物功能摄食类群存在显著的相关性(P<0.05), 2011年8月沉积物中值粒径与黄海大型底栖动物功能摄食类群存在显著相关(P<0.05)。选取的环境因子与功能摄食类群及排序轴之间的相关性均显著(P<0.05), 分析结果见表 3。
 |
| 图 5 2011年4月(a)和8月(b)航次黄海大型底栖动物与环境变量之间的冗余分析 Fig. 5 Relationships of macrozoobenthos and environmental factors obtained by redundancy analysis (RDA) in April and August 2011 in the Yellow Sea 注: RDA1和RDA2分别为冗余分析第一和第二典范轴; A1—I4分别为2011年4月和8月航次的采样站位 |
| 航次 | 环境因子 | 自由度Df | 方差膨胀因子VIF | F值 | P值 |
| 2011年4月 | 盐度 | 1 | 5.545 | 5.725 | 0.004** |
| 温度 | 1 | 5.120 | 5.286 | 0.004** | |
| 水深 | 1 | 6.792 | 7.012 | 0.001*** | |
| 2011年8月 | 中值粒径 | 1 | 10273 | 4.174 | 0.037* |
| 注: ***、**、*分别表示在1%、5%、10%的水平上显著 | |||||
本研究结果表明黄海大型底栖动物功能摄食类群相对丰度较高的为食底泥者和肉食者。与国内外不同研究水域大型底栖动物功能摄食类群研究结果的比较见表 4。食底泥者相对丰度较高的区域沉积物有机质含量较丰富, 沉积物中的有机碎屑在近海水域食物网的物质流中起着主要作用(Muniz et al, 1999; García-Arberas et al, 2002)。黄海沉积物主要为粉砂和泥质沉积, 泥质沉积物粒径较小, 存在有机质富集的特征(熊林芳等, 2013)。本研究功能摄食类群的优势种主要为背蚓虫Notomastus latericeus、拟特须虫Paralacydonia paradoxa、角海蛹Ophelina acuminate、掌鳃索沙蚕Ninöe palmata、不倒翁虫Sternaspis scutata和多丝独毛虫Tharyx multifilis, 肉食者的优势种为寡鳃齿吻沙蚕Nephtys oligobranchia。上述功能群优势物种主要以沉积物中有机质为饵料(蔡立哲等, 2001; 王金宝等, 2006; Callier et al, 2007)。近岸水循环能力较弱, 这一水文特征有利于食底泥者的摄食和运动, 使这些水域的食底泥者优势程度较高(Chardy et al, 1988; Levinton et al, 1988; Boaventura et al, 1999; Dolbeth et al, 2007)。
| 调查区域 | 相对丰度较高的功能摄食类群 | 参考文献 |
| 巴西Ubatuba湾 | 食底泥者、肉食者 | (Santos et al, 2004) |
| 葡萄牙Tagus河口 | 食底泥者、肉食者 | (Gaudêncio et al, 2007) |
| 西班牙维哥湾 | 食底泥者、肉食者 | (Cacabelos et al, 2009) |
| 澳大利亚Spencer湾 | 食底泥者、肉食者 | (Putro, 2009) |
| 深海 | 食底泥者、滤食者和肉食者 | (Sokolova, 1972) |
| Calcasieu河口 | 食底泥者、滤食者 | (Gaston et al, 1998) |
| 葡萄牙沿岸 | 食底泥者、滤食者 | (Boaventura et al, 1999) |
| New Caledonia潟湖 | 滤食者 | (Chardy et al, 1988) |
| 长江口九段沙 | 肉食者、植食者、滤食者 | (袁兴中等, 2002) |
| 灵昆岛潮滩 | 肉食者、植食者、滤食者 | (葛宝明等, 2008) |
| 胶州湾潮滩 | 滤食者和肉食者 | (辛俊宏等, 2011) |
| 莱州湾 | 肉食者和食底泥者 | (李少文等, 2013) |
不同时空尺度对大型底栖动物营养结构时空格局的影响因素存在差异, 在大尺度上, 大型底栖动物营养结构的时空格局主要受物理因素如海底地形、洋流和季风影响, 在小尺度上则受环境异质性和生物交互作用的影响(Hall et al, 1994; Legendre et al, 1997; Ysebaert et al, 2002)。李新正等(2010)认为黄海水域的大型底栖动物分布特征与水文和底质环境密切相关。沉积物蕴含许多地质和环境信息, 可以反映底栖动物栖息地环境质量状况(王丽萍等, 2008)。海洋沉积物中有机碳的累积率被认为是表层海水初级生产力的指示标志(蔡德陵等, 2014)。黄海位于中国大陆污染物向太平洋输送的通道(Guo et al, 2006), 黄海南部近200年初级生产力的波动上升主要受营养盐输入的影响, 其中陆源营养物质和污染物质起重要作用(蔡德陵等, 2014)。陈建芳等(2005)研究发现陆源有机质的输送是黄海泥质区沉积物有机质的主要来源。本研究2011年8月航次的食底泥者和肉食者相对丰度较2000年10月和2001年3月航次高, 而且10年间黄海大型底栖动物食底泥者的现存量呈增长趋势, 可能与陆源营养物质输送量较高有关。本研究食底泥者优势种背蚓虫、拟特须虫、角海蛹、掌鳃索沙蚕和多丝独毛虫属于Grall和Glémarec划分的GroupⅢ组物种(Grall et al, 1997), 对有机质耐受性较强, 物种种群数量随有机质大量输入而激增(Borja et al, 2000)。Papageorgiou等(2006)认为时间尺度上食底泥者(如多毛环节动物)现存量的变化能反映底栖生态环境状况的变化。本研究食底泥者的代表种背蚓虫在2011年8月航次丰度达到885ind./m2, 物种优势度较以往航次高, 可能与黄海底栖生态环境状况的变化有关。
大型底栖动物营养结构的季节变异与生物繁殖特征、种间关系和人类干扰程度有关(Naumov, 2006)。Shin等(2008)认为在水和沉积物环境状况稳定的区域, 幼体补充是大型底栖动物营养结构时空变化的主要影响因素。本研究食底泥者主要分布在黄海冷水团周边的泥质堆积区, 这些区域沉积物环境状况较稳定, 营养结构季节变异主要受种群补充影响。肉食者优势种寡鳃齿吻沙蚕主要分布在黄海近岸水域, 该种属于GroupⅢ分组中的物种, 其数量的季节变化主要受沉积物有机质丰富程度影响。黄海冷水团肉食者优势种浅水萨氏真蛇尾和紫蛇尾主要受到黄海冷水团控制, 所处的中央深水区具有稳定的低温高盐环境特征, 而且该水域的营养结构时间变异较小。此外, 一些游泳性的甲壳类动物由于索饵和越冬导致肉食者丰度在局部水域出现季节变动, 例如鹰爪虾群冬季向黄海南部中央水域收缩。局部肉食者的大量出现表明碳流在食物网中能充分支撑高营养级生物(Wijsman et al, 1999), 例如摄食双壳类的脊腹褐虾是黄海鱼类的主要竞争对象(张波, 2005)。影响滤食者季节分布的主要因素是盐度(Ysebaert et al, 1998)。本研究结果表明, 一部分滤食者为低温高盐种, 如日本胡桃蛤和薄索足蛤, 主要分布在黄海冷水团区域, 受黄海冷水团影响, 时空变异较稳定。
大型底栖动物营养结构空间分布格局是多种因素如盐度、有机质含量(Harmelin-Vivien et al, 2009)、水文状况(Dolbeth et al, 2007)、沉积物状况(García-Arberas et al, 2002)、饵料丰富程度(Incera et al, 2003)、人类胁迫等交互作用的结果(Rosenberg et al, 2009)。本研究黄海大型底栖动物食底泥者和肉食者主要分布在黄海近岸水域, 这些水域的泥质堆积区沉积物有机碳含量较高, 苏北和鲁北沿岸径流带来的大量有机质入海, 导致近海水体有机质颗粒浓度较高, 促进陆源有机质颗粒在海洋食物网中的流动, 导致该水域一些多毛类食底泥者数量激增, 造成大型底栖动物群落营养结构简单化, 多样性减少。黄海冷水团外围分布一定数量滤食者。滤食者的空间分布格局与沉积物粒径有关, 滤食者通常分布在溶解氧的浓度较高, 有机质含量较低, 底质较粗, 且沉积物孔隙水循环状态较好的区域(Chasse, 1972; Diaz et al, 1995; Rakocinski, 2012)。有研究报道, 黄海冷水团周边区域为粉砂底质适合薄索足蛤等滤食者生存, 薄索足蛤在此区域现存量较大, 具有较高的次级生产力(曲方圆, 2010)。
在营养结构格局演变过程中, 时空变异交互作用对总变异的贡献程度较单纯时间引起的变异要大(Fraschetti et al, 2005)。国内外有关时空变异交互作用的在多尺度生物群落时空演变中的重要性有所报道(Anderson et al, 2005; Dethier et al, 2005; 曲方圆, 2010)。本研究发现除近岸人类扰动比较频繁的水域, 黄海大型底栖动物营养结构空间格局的变化较稳定。有关季节变异和年际变异对大型底栖动物营养结构作用强度需要获取研究水域详细的生物学数据, 有助于了解驱动营养结构变化的生态学过程(Dethier et al, 2005)。例如, 黄海暖流存在着一定的季节和年际变异(陈建芳等, 2005), 上述变异对大型底栖动物时空分布影响强度需要深入研究。
3.3 摄食多样性指数在评价底栖生态质量状况中的应用不同物种经过功能摄食类群的划分, 减弱了Shannon–Wiener指数对稀有种的敏感性(Krebs, 1999), 能有效指示环境状况(Gamito et al, 2009)。本研究运用摄食多样性指数, 从大型底栖动物功能层面评价黄海底栖生态健康状况, 效果较好。摄食多样性指数以香浓威纳指数为基础, 其结果受采样随机性和环境异质性影响较大, 尤其在较大空间尺度的运用具有局限性。例如某些区域物种数量少、功能群单一, J′FD指数可能较低, Gamito等(2009)指出如果功能群物种数较少, J′FD指数阈值0.2还需要下调。J′FD指数较低并不意味着底栖群落受到扰动, 除一些耐污种, 局部优势种也会影响指数结果的准确度。
使用J′FD指数对水域生态环境进行评价, 掌握评价区域环境和物种的基础生物学特性十分必要。环境的变异以及不同发育阶段物种食性的转变, 导致物种功能摄食类群数量改变。例如, 由于分布以及栖息环境的不同, Fenchel等(1975)将为腹足动物Hydrobia ulvae划分为食底泥者, 而Baeta等(2009)则认为H. ulvae为植食者或食碎屑者。目前评价近海水域生态健康状况综合运用的指数类型较多(Sany et al, 2015), 主要侧重于人类胁迫的影响。应用这些指数可较好了解大型底栖动物群落时空变异程度, 但存在生态适用性较弱等缺点。此外指数评价体系的建立及环境质量评估基线制定较难, 需要连续获取研究区域大量的环境和物种详实的数据(Gamito et al, 2009)。本研究从食性层面对黄海300多种大型底栖动物物种进行功能摄食类群的划分, 其中有许多物种基础生物学特征, 尤其不同发育阶段食性的变化特征尚不明确, 需要结合同位素及分子手段进行研究。
4 结论(1) 黄海大型底栖动物相对丰度较高的摄食类群为肉食者、食底泥者和滤食者。黄海大型底栖动物食底泥者和肉食者相对丰度高值出现在2011年8月航次, 分别为44.88%和39.04%。
(2) 黄海大型底栖动物空间分布以黄海冷水团区域为参照, 黄海大型底栖动物肉食者主要分布在黄海冷水团边缘靠近海州湾东侧。食底泥者主要分布在黄海近岸及黄海冷水团边缘。滤食者主要分布在黄海冷水团中央区域。
(3) 运用冗余分析对黄海大型底栖动物功能摄食类群与水温、水深、盐度、沉积物总氮、沉积物总有机碳和中值粒径等6个环境因子进行耦合分析。结果表明, 2011年4月底层水的盐度、温度和水温与黄海大型底栖动物功能摄食类群存在显著的相关性(P<0.05), 2011年8月沉积物中值粒径与黄海大型底栖动物功能摄食类群存在显著相关(P<0.05)。
王丽萍, 周晓蔚, 郑丙辉, 等. 2008. 长江口及毗邻海域沉积物生态环境质量评价. 生态学报, 28(5): 2191-2198 DOI:10.3321/j.issn:1000-0933.2008.05.035 |
王金宝, 李新正, 王洪法. 2006. 胶州湾多毛类环节动物优势种的生态特点. 动物学报, 52(1): 63-69 |
曲方圆, 2010.北黄海春秋季大型底栖动物生态学研究.青岛: 中国海洋大学硕士学位论文 http://cdmd.cnki.com.cn/Article/CDMD-10423-1011027111.htm
|
朱晓君, 陆健健. 2003. 长江口九段沙潮间带底栖动物的功能群. 动物学研究, 24(5): 355-361 DOI:10.3321/j.issn:0254-5853.2003.05.006 |
苏纪兰, 唐启升. 2002. 中国海洋生态系统动力学研究Ⅱ渤海生态系统动力学过程. 北京: 科学出版社, 445
|
李少文, 刘元进, 李凡, 等. 2013. 莱州湾大型底栖动物功能群现状. 生态学杂志, 32(2): 380-388 |
李荣冠. 2003. 中国海陆架及邻近海域大型底栖生物. 北京: 海洋出版社, 164
|
李新正, 刘录三, 李宝泉. 2010. 中国海洋大型底栖生物:研究与实践. 北京: 海洋出版社, 122
|
辛俊宏, 任一平, 徐宾铎, 等. 2011. 胶州湾西北部潮滩湿地大型底栖动物功能群. 应用生态学报, 22(7): 1885-1892 |
张波, 2005.中国近海食物网及鱼类营养动力学关键过程的初步研究.青岛: 中国海洋大学博士学位论文 http://cdmd.cnki.com.cn/article/cdmd-10423-2005140433.htm
|
陈建芳, 金海燕, 刘小涯, 等. 2005. 黄海和东海沉积物有机质活性及营养盐再生潜力初探. 地球化学, 34(4): 387-394 DOI:10.3321/j.issn:0379-1726.2005.04.010 |
袁兴中, 陆健健, 刘红. 2002. 长江口底栖动物功能群分布格局及其变化. 生态学报, 22(12): 2054-2062 DOI:10.3321/j.issn:1000-0933.2002.12.006 |
彭松耀, 李新正. 2013. 乳山近海大型底栖动物功能摄食类群. 生态学报, 33(17): 5274-5285 |
葛宝明, 鲍毅新, 程宏毅, 等. 2008. 灵昆岛东滩潮间带大型底栖动物功能群及营养等级构成. 生态学报, 28(10): 4797-4804 |
蔡立哲, 厉红梅, 刘俊杰, 等. 2001. 深圳河口泥滩三种多毛类的数量季节变化及污染影响. 生态学报, 21(10): 1649-1653 |
蔡德陵, 孙耀, 张小勇, 等. 2014. 由东海、黄海沉积物中有机碳含量及稳定同位素组成重建200a以来初级生产力历史记录. 海洋学报, 36(2): 40-50 DOI:10.3969/j.issn.0253-4193.2014.02.005 |
熊林芳, 石学法, 邓煜, 等. 2013. 南黄海、东海北部陆架区表层沉积物有机质分布特征. 海洋通报, 32(3): 281-286 |
Anderson M J, Connell S D, Gillanders B M et al, 2005. Relationships between taxonomic resolution and spatial scales of multivariate variation. Journal of Animal Ecology, 74(4): 636-646 |
Baeta A, Valiela I, Rossi F et al, 2009. Eutrophication and trophic structure in response to the presence of the eelgrass Zostera noltii. Marine Biology, 156(10): 2107-2120 DOI:10.1007/s00227-009-1241-y |
Boaventura D, da Fonseca L C, Teles-Ferreira C, 1999. Trophic structure of macrobenthic communities on the Portuguese coast. A review of lagoonal, estuarine and rocky littoral habitats. Acta Oecologica, 20(4): 407-415 DOI:10.1016/S1146-609X(99)00127-7 |
Borja A, Franco J, Pérez V, 2000. A Marine Biotic Index to establish the ecological quality of soft-bottom benthos within European estuarine and coastal environments. Marine Pollution Bulletin, 40(12): 1100-1114 DOI:10.1016/S0025-326X(00)00061-8 |
Bremner J, Rogers S I, Frid C L J, 2006. Methods for describing ecological functioning of marine benthic assemblages using biological traits analysis (BTA). Ecological Indicators, 6(3): 609-622 DOI:10.1016/j.ecolind.2005.08.026 |
Cacabelos E, Domínguez M, Troncoso J S, 2009. Trophic structure of soft-bottom macrobenthos in an inlet in north-western Spain. Journal of the Marine Biological Association of the United Kingdom, 89(3): 439-447 DOI:10.1017/S0025315409003105 |
Callier M D, McKindsey C W, Desrosiers G, 2007. Multi-scale spatial variations in benthic sediment geochemistry and macrofaunal communities under a suspended mussel culture. Marine Ecology Progress Series, 348: 103-115 DOI:10.3354/meps07034 |
Chardy P, Clavier J, 1988. Biomass and trophic structure of the macrobenthos in the south-west lagoon of New Caledonia. Marine Biology, 99(2): 195-202 |
Chasse C J M, 1972. Économie sedimentaire et biologique des estrans meubles des côtes de Bretagne. Paris, France: Doctor Dissertation of University of Paris, 293
|
Cummins K W, 1974. Structure and function of stream ecosystems. BioScience, 24(11): 631-641 DOI:10.2307/1296676 |
Dethier M N, Schoch G C, 2005. The consequences of scale:assessing the distribution of benthic populations in a complex estuarine fjord. Estuarine, Coastal and Shelf Science, 62(1-2): 253-270 DOI:10.1016/j.ecss.2004.08.021 |
Diaz R J, Rosenberg R, 1995. Marine benthic hypoxia:a review of its ecological effects and the behavioural responses of benthic macrofauna. Oceanography and Marine Biology, 33: 245-303 |
Dolbeth M, Ferreira Ó, Teixeira H et al, 2007. Beach morphodynamic impact on a macrobenthic community along a subtidal depth gradient. Marine Ecology Progress, 352: 113-124 DOI:10.3354/meps07040 |
Dolbeth M, Teixeira H, Marques J C et al, 2009. Feeding guild composition of a macrobenthic subtidal community along a depth gradient. Scientia Marina, 73(2): 225-237 DOI:10.3989/scimar.2009.73n2225 |
Fauchald K, Jumars P A, 1979. The diet of worms:a study of polychaete feeding guilds. Oceanography and Marine Biology:An Annual Review, 17: 193-284 |
Fenchel T, Kofoed L H, Lappalainen A, 1975. Particle size-selection of two deposit feeders:the amphipod Corophium volutator and the prosobranch Hydrobia ulvae. Marine Biology, 30(2): 119-128 DOI:10.1007/BF00391586 |
Fraschetti S, Terlizzi A, Benedetti-Cecchi L, 2005. Patterns of distribution of marine assemblages from rocky shores:evidence of relevant scales of variation. Marine Ecology Progress Series, 296: 13-29 DOI:10.3354/meps296013 |
Gamito S, 2008. Three main stressors acting on the Ria Formosa lagoonal system (Southern Portugal):physical stress, organic matter pollution and the land-ocean gradient. Estuarine, Coastal and Shelf Science, 77(4): 710-720 |
Gamito S, Furtado R, 2009. Feeding diversity in macroinvertebrate communities:a contribution to estimate the ecological status in shallow waters. Ecological Indicators, 9(5): 1009-1019 DOI:10.1016/j.ecolind.2008.11.012 |
García-Arberas L, Rallo A, 2002. Life cycle, demography and secondary production of the Polychaete Hediste diversicolor in a non-Polluted estuary in the Bay of Biscay. Marine Ecology, 23(3): 237-251 DOI:10.1046/j.1439-0485.2002.02766.x |
Gaston G R, 1987. Benthic polychaeta of the Middle Atlantic Bight:feeding and distribution. Marine Ecology Progress Series, 36: 251-262 DOI:10.3354/meps036251 |
Gaston G R, Rakocinski C F, Brown S S et al, 1998. Trophic function in estuaries:response of macrobenthos to natural and contaminant gradients. Marine and Freshwater Research, 49(8): 833-846 DOI:10.1071/MF97089 |
Gaudêncio M J, Cabral H N, 2007. Trophic structure of macrobenthos in the Tagus estuary and adjacent coastal shelf. Hydrobiologia, 587(1): 241-251 DOI:10.1007/s10750-007-0686-6 |
Grall J, Glémarec M, 1997. Using biotic indices to estimate macrobenthic community perturbations in the Bay of Brest. Estuarine, Coastal and Shelf Science, 44(S1): 43-53 |
Guo Z G, Lin T, Zhang G et al, 2006. High-resolution depositional records of polycyclic aromatic hydrocarbons in the central continental shelf mud of the East China Sea. Environmental Science & Technology, 40(17): 5304-5311 |
Hall S J, Raffaelli D, Thrush S F, 1994. Patchiness and disturbance in shallow water benthic assemblages. In: Hildrew A G, Giller P S, Raffaelli D eds. Aquatic Ecology: Scale, Pattern, and Process. Oxford: Blackwell Scientific Publications, 333-375
|
Harmelin-Vivien M L, Banaru D, Dierking J et al, 2009. Linking benthic biodiversity to the functioning of coastal ecosystems subjected to river runoff (NW Mediterranean). Animal Biodiversity and Conservation, 32(2): 135-145 |
Incera M, Cividanes S P, López J et al, 2003. Role of hydrodynamic conditions on quantity and biochemical composition of sediment organic matter in sandy intertidal sediments (NW Atlantic coast, Iberian Peninsula). Hydrobiologia, 497(1-3): 39-51 |
Krebs C J, 1999. Ecological Methodology. 2nd ed. Menlo Park, California: Benjamin Cummings
|
Lavesque N, Blanchet H, De Montaudouin X, 2009. Development of a multimetric approach to assess perturbation of benthic macrofauna in Zostera noltii beds. Journal Experimental Marine Biology and Ecology, 368(2): 101-112 |
Legendre P, Thrush S F, Cummings V J et al, 1997. Spatial structure of bivalves in a sandflat:scale and generating processes. Journal of Experimental Marine Biology and Ecology, 216(1-2): 99-128 |
Levinton J S, Stewart S, 1988. Effects of sediment organics, detrital input, and temperature on demography, production, and body size of a deposit feeder. Marine Ecology Progress Series, 49: 259-266 |
Macdonald T A, Burd B J, Van Roodselaar A, 2012. Facultative feeding and consistency of trophic structure in marine soft-bottom macrobenthic communities. Marine Ecology Progress Series, 445: 129-140 DOI:10.3354/meps09478 |
Muniz P, Pires A M S, 1999. Trophic structure of polychaetes in the São Sebastião Channel (southeastern Brazil). Marine Biology, 134(3): 517-528 DOI:10.1007/s002270050567 |
Naumov A D, 2006. Clams of the White Sea: Ecological and Faunistic Analysis. Explorations of Fauna of the Seas. St. Peterburg: Zoological Institute of the Russian Academy of Sciences, 67
|
Papageorgiou N C, Arvanitidis C, Eleftheriou A, 2006. Multicausal environmental severity:a flexible framework for microtidal sandy beaches and the role of polychaetes as an indicator taxon. Estuarine, Coastal and Shelf Science, 70(4): 643-653 |
Pearson T H, 1971. Studies on the ecology of the macrobenthic fauna of Lochs Linnhe and Eil, west coast of Scotland. Ⅱ. Analysis of the macrobenthic fauna by comparison of feeding groups. Vie et Milieu, (S22): 53-91 |
Putro S P, 2009. Response of trophic groups of macrobenthic fauna to environmental disturbance caused by fish farming. Journal of Coastal Development, 12(3): 155-166 |
Rakocinski C F, 2012. Evaluating macrobenthic process indicators in relation to organic enrichment and hypoxia. Ecological Indicators, 13(1): 1-12 DOI:10.1016/j.ecolind.2011.04.031 |
Rosenberg R, Magnusson M, Nilsson H C, 2009. Temporal and spatial changes in marine benthic habitats in relation to the EU Water Framework Directive:the use of sediment profile imagery. Marine Pollution Bulletin, 58(4): 565-572 DOI:10.1016/j.marpolbul.2008.11.023 |
Sanchez-Mata A, Lastra M, Mora J, 1993. Macrobenthic crustacean characterization of an estuarine area. Crustaceana, 64(3): 337-355 DOI:10.1163/156854093X00685 |
Santos M F L, Pires-Vanin A M S, 2004. Structure and dynamics of the macrobenthic communities of Ubatuba Bay, southeastern Brazilian Coast. Brazilian Journal of Oceanography, 52(1): 59-73 DOI:10.1590/S1679-87592004000100006 |
Sany S B T, Hashim R, Salleh A et al, 2015. Ecological quality assessment based on macrobenthic assemblages indices along West Port, Malaysia coast. Environmental Earth Sciences, 74(2): 1331-1341 DOI:10.1007/s12665-015-4122-3 |
Shin P K S, Lam N W Y, Wu R S S et al, 2008. Spatio-temporal changes of marine macrobenthic community in sub-tropical waters upon recovery from eutrophication. I. Sediment quality and community structure. Marine Pollution Bulletin, 56(2): 282-296 DOI:10.1016/j.marpolbul.2007.10.023 |
Sokolova N N, 1972. Trophic structure of deep-sea macrobenthos. Marine Biology, 16(1): 1-12 |
Thrush S F, Schneider D C, Legendre P et al, 1997. Scaling-up from experiments to complex ecological systems:where to next?. Journal of Experimental Marine Biology and Ecology, 216(1-2): 243-254 DOI:10.1016/S0022-0981(97)00099-3 |
Turner S J, Grant J, Pridmore R D et al, 1997. Bedload and water-column transport and colonization processes by post-settlement benthic macrofauna:does infaunal density matter?. Journal of Experimental Marine Biology and Ecology, 216(1-2): 51-75 DOI:10.1016/S0022-0981(97)00090-7 |
Underwood A J, Chapman M G, 2003. Power, precaution, Type Ⅱ error and sampling design in assessment of environmental impacts. Journal of Experimental Marine Biology and Ecology, 296(1): 49-70 DOI:10.1016/S0022-0981(03)00304-6 |
Underwood A J, Chapman M G, Connell S, 2000. Observations in ecology:you can't make progress on processes without understanding the patterns. Journal of Experimental Marine Biology and Ecology, 250(1-2): 97-115 DOI:10.1016/S0022-0981(00)00181-7 |
Weston D P, 1990. Quantitative examination of microbenthic community changes along an organic enrichment gradient. Marine Ecology Progress Series, 61: 233-244 DOI:10.3354/meps061233 |
Wijnhoven S, Hummel H, 2011. Patterns in macrozoobenthic assemblages indicate the state of the environment:insights from the Rhine-Meuse estuary. Marine Ecology Progress Series, 436: 29-50 DOI:10.3354/meps09210 |
Wijsman J W M, Herman P M J, Gomoiu M T, 1999. Spatial distribution in sediment characteristics and benthic activity on the Northwestern Black Sea shelf. Marine Ecology Progress Series, 181: 25-39 DOI:10.3354/meps181025 |
Ysebaert T, Herman P M J, 2002. Spatial and temporal variation in benthic macrofauna and relationships with environmental variables in an estuarine, intertidal soft-sediment environment. Marine Ecology Progress Series, 244: 105-124 DOI:10.3354/meps244105 |
Ysebaert T, Meire P, Coosen J et al, 1998. Zonation of intertidal macrobenthos in the estuaries of Schelde and Ems. Aquatic Ecology, 32(1): 53-71 |
 2020, Vol. 51


