中国海洋湖沼学会主办。
文章信息
- 侯华千, 谢强, 陈更新, 何云开, 舒业强, TILAK Priyadarshana, 姚景龙, 王东晓. 2016.
- HOU Hua-Qian, XIE Qiang, CHEN Geng-Xin, HE Yun-Kai, SHU Ye-Qiang, TILAK Priyadarshana, YAO Jing-Long, WANG Dong-Xiao. 2016.
- 2005-2009年、2011年和2013年南海东北部120°E断面秋季体积输运的年际变化
- OBSERVED INTER-ANNUAL VARIABILITY OF VOLUME TRANSPORT AT 120°E TRANSECT IN NORTHEASTERN SOUTH CHINA SEA
- 海洋与湖沼, 47(1): 36-42
- Oceanologia et Limnologia Sinica, 47(1): 36-42.
- http://dx.doi.org/10.11693/hyhz20150400125
-
文章历史
- 收稿日期: 2015-04-26
- 收修改稿日期: 2015-09-10
2. 中国科学院大学 北京 100049;
3. 中国科学院三亚深海科学与工程研究所 三亚 572000;
4. Faculty of Fisheries and Marine Sciences & Technology University of Ruhuna,Matara, Sri Lanka
2. University of Chinese Academy of Sciences, Beijing 100049, China;
3. Institute of Deep-Sea Science and Engineering, Chinese Academy of Sciences, Sanya 572000, China;
4. Faculty of Fisheries and Marine Sciences & Technology University of Ruhuna, Matara, Sri Lanka
吕宋海峡位于台湾岛和吕宋岛之间,其宽度大约为350km,海槛深度在2400—2600m之间,是连接中国南海与西太平洋的唯一深水通道。南海与西太平洋在吕宋海峡存在显著的水交换,吕宋海峡体积输运强弱能影响整个南海,特别是南海北部的环流结构(Wyrtki et al,1961; Nitani,1972; Qiu et al,1996; Hu et al,2000; Yaremchuk et al,2009; Chen et al,2011a,2014; Nan et al,2014; Su et al,2014)。
吕宋海峡体积输运存在显著的季节和年际变化,主要被黑潮入侵、ENSO、中尺度涡和季风等四种因素所控制(Qu,2000; Centurioni et al,2004; Zhao et al,2009; Chen et al,2011a,b)。东北季风利于黑潮入侵南海,因而冬季体积输运普遍高于夏季(Wyrtki,1961; Fang et al,2005)。Qu等(2004,2006)的模式研究表明,吕宋海峡体积输运在El Niño年份相对较高,La Niña年份相对较低。Rong等(2007)基于多年的海表高度数据和World Ocean Atlas 2001(WOD01)海温数据,得到了多年冬季和春季的吕宋海峡体积输运,指出ENSO能够影响整个南海的海表高度和海表温度,进而影响南海和周围大洋的水体交换,包括吕宋海峡水输运。亚热带的模态水由于存在太平洋年代际震荡(PDO)的影响,同样影响吕宋海峡次表层的体积输运,并使其产生年际变化(Yu et al,2015)。
吕宋海峡体积输运随深度亦有显著变化。研究发现,吕宋海峡存体积输运在上、下层西向,中层东向的斜压“三明治”结构,其中上层大约为表层至到500m,中层为500—1500m,下层为1500m以下(Tian et al,2006; Liang et al,2008; Yuan et al,2008,2009)。每一层水流方向沿经线呈现交替分布(Qu et al,2004; Tian et al,2006; Zhou et al,2009)。Tian等(2006)年基于2005年10月断面水文观测和同期LADCP数据计算表明,上层体积输运约为–9Sv,中层体积输运约为5Sv,下层约为–2Sv。然而,Yang等(2010)研究表明,2007年6月吕宋海峡对应的三层体积输运分别为5Sv、2.5Sv和–2Sv,未出现“三明治”结构。
由于观测资料的限制,吕宋海峡流场结构、体积输运的垂向分布特征等尚不明确,需要进一步研究。本文基于7年九月份的水文观测资料,研究吕宋海峡120°E断面流场结构、体积输运。下文第一部分介绍本文使用的数据和方法; 第二部分探讨断面流场结构、体积输运等的年际变化。
1 数据与方法自2004年以来,中国科学院南海海洋研究所每年8月底至10月初皆对吕宋海峡附近南海东北部120°E断面进行水文观测(2012年除外),观测范围通常为北纬19.5°—21.5°N(2006年和2013年为19°N至21.5°N),采样间隔为0.5°,观测深度一般为1500m。所使用的CTD的温度精度为10–4 ℃,盐度精度为10–3,采样频率为24Hz(Zeng et al,2015)。其中2005年出现少量位置数据异常,通过周围有效数据点插值修正。2004年与2010年由于CTD绞车故障,观测深度分别仅为200m和500m,不能有效用于吕宋海峡水交换研究。故本文用到的CTD数据年份为2005—2009年、2011年和2013年,各年CTD站位如图 1所示。
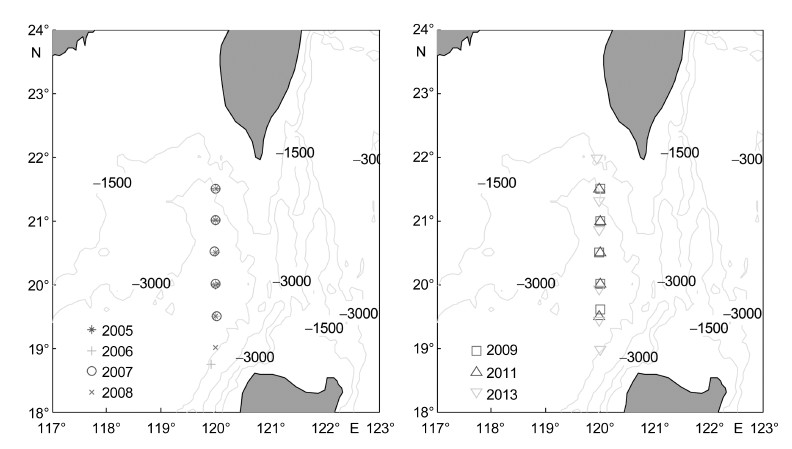 |
| 图 1 南海东北部120°E北部断面2005年至2013站位图和水深图 Fig. 1 The stations at the transect of 120°E northeast of South China Sea from 2005 to 2013 and the topography |
基于温盐观测,本文先计算120°E断面地转流。地转流计算公式为:

进一步,通过对流速的垂直模态分解(Gill,1984),获得120°E断面流场的正压和斜压特性。分解结果中,第零阶模态为正压模态,速度大小和方向沿垂向均一致; 第一模态为第一斜压模态,速度方向沿深度出现一次变换; 第二模态为第二斜压模态,速度方向沿深度出现两次变换。以此类推,越高阶的斜压模态沿水深方向越复杂,其信号也通常越弱。一般对于大洋的研究,计算到第二斜压模态即可(Gill,1984)。
2 结果分析 2.1 流场结构图 2给出了120°E断面各年的流速结构。可以发现,2005、2006、2007年和2013年流速在垂向上存在明显的斜压特征。这几年,在300m以下的深度,某个特定纬度处(2005年在20°N,2006年在19.5°N,2007年在21°N,2013年在20.5°N),存在一个西向的流核(图 2中的蓝色区域),而该西向流核的上方存在显著的东向流。这一现象印证了吕宋海峡的“三明治”结构的上两层部分。
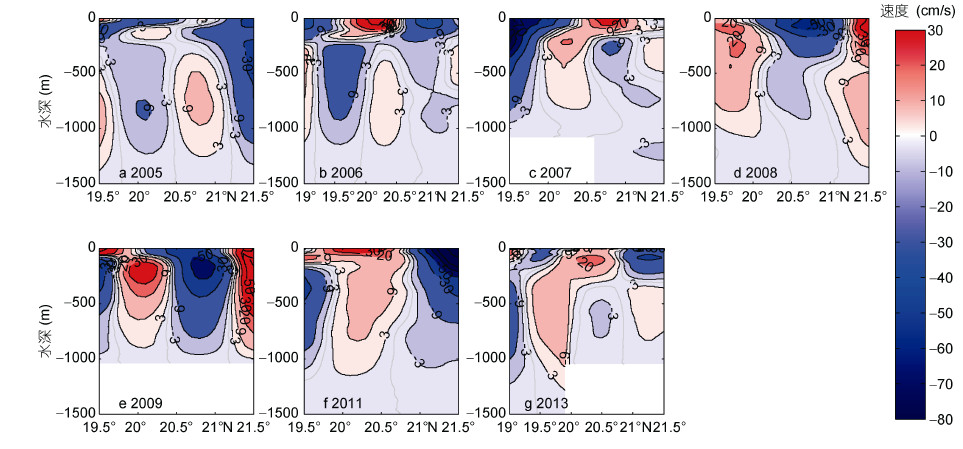 |
| 图 2 各年120°E断面流场分布 其中红色为东向(为正),蓝色为西向(为负)。下标a、b、c、d、e、f、g分别表示2005—2009,2011和2013年 Fig. 2 The velocity field in 120°E transect Red means eastward, blue means westward. The subscripts of a, b, c, d, e, f, g represent the years of 2005, 2006, 2007, 2008, 2009, 2011, 2013, respectively |
相比于上述4年,2008年、2009年和2011年流场在垂向上无明显速度反向,呈准正压结构。2008年和2009年的流场结构有些相似,120°E断面南、北两端皆出现东向水输运,而在海峡中部20.5°—21°N区域存在西向水输运。2011年的情况恰好相反,海峡南、北两端是西向水输运,而海峡中部19.7°—21.7°N是东向水输运。
综上,2005、2006、2007年和2013年流场分布斜压性强,呈现“三明治”结构的上两层,上中层分界深度大约为100m至400m,随年份变化; 2008年、2009年和2011年流场呈现准正压形态,“三明治”结构不明显或者不存在。以上结果表明,吕宋海峡流场结构具有显著的年际变化,并非一直呈前人揭示的“三明治”结构。
2.2 体积输运将流场沿经向积分,可以得到120°E断面体积输运的垂向分布特征。由于每年观测范围不同,我们将经度积分范围统一取为19.5°—21.5°N,计算结果如图 3a所示。120°E断面体积输运随深度呈现显著变化: 2005年、2007年和2011年,这3年的体积输运方向随着深度不变,皆为西向(图中正值为东向),总输运显正压; 2008年和2013年,这两年表层至大约200m左右的体积输运方向为西向,中层体积输运方向转变为东向,总输运显斜压; 而2006年和2009年,这两年约50m层以上呈东向输运,次表层和中层则为西向输运,总输运亦显斜压。
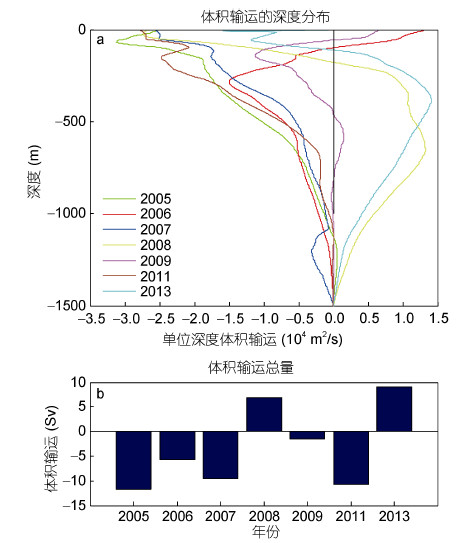 |
| 图 3 各年体积输运沿深度的分布图;(b)各年体积输运总量图 Fig. 3 The vertical structure of volume transport;(b)The total volume transport |
进一步,将体积输运垂向积分,得到截面的净体积输运。净体积输运呈显著的年际变化(图 3b): 在2005年出现西向最大体积输运,为–11.2Sv; 在2013年出现东向最大体积输运,为9.1Sv; 在2009年出现最弱体积输运,仅为–1.2Sv。7年观测中,仅2008年和2013年出现了东向体积输运。其中,2008年东向输运可能是由于该年黑潮流套入侵(Chen et al,2011b)在台湾岛西南部产生大的东向体积输运所致。
2.3 模态分解与模态通量分析为进一步研究120°E断面流场分布的正斜压特性,我们对流速较强的上层1000m流场进行模态分解,结果如图 4所示。通过图 4可以发现正压模态与前两斜压模态即可表征当年的流场特征,剩余模态流速较小(图 4第一行)。
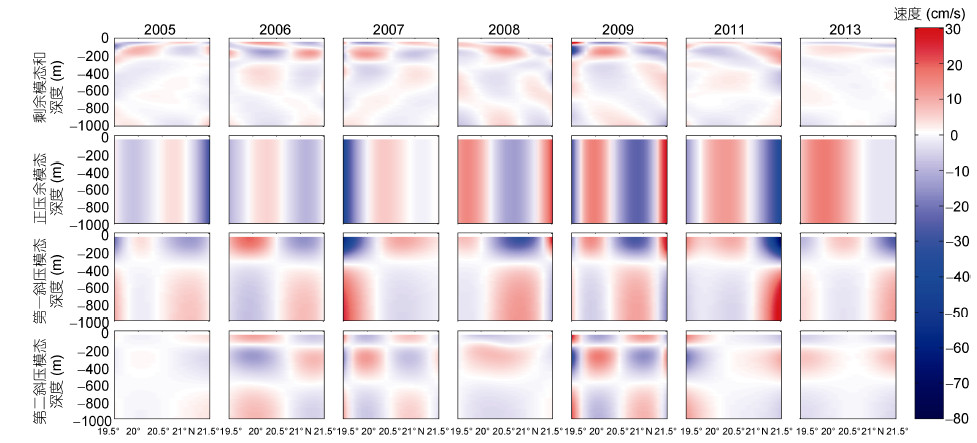 |
| 图 4 各年的模态分解结果,其中红色代表东向流速(为正),蓝色代表西向流速(为负) 从上到下每一行分别是: 剩余模态的和、正压模、第一斜压模和第二斜压模 Fig. 4 The normal mode solution of each year. Red means eastward,blue means westward The first line is the sum of other modes,the second line is barotropical mode,the third line is baroclinic mode 1,and the last line is baroclinic mode2 |
通过计算各模态速率的平均值,可以揭示各个模态的强弱(表 1)。其中准正压结构流场2008年、2009年和2011年,最大,它们速率平均值分别为0.102m/s、0.157m/s和0.123m/s,远大于最大的斜压模态,并且每年第一斜压模态都大于第二斜压模态。对于最大速度出现在海表的2008年和2011年,第二斜压模态相对较小,但对于最大速度出现在中层(200m—400m)的2009年,第一斜压模态和第二斜压模态贡献相差不大。
| 年份 | 速率的平均值(m/s) | |||
| 正压模态 | 第一斜压模态 | 第二斜压模态 | ||
| 斜压 结构 年份 | 2005 | 0.037 | 0.033 | 0.006 |
| 2006 | 0.047 | 0.051 | 0.041 | |
| 2007 | 0.026 | 0.028 | 0.028 | |
| 2013 | 0.049 | 0.044 | 0.016 | |
| 正压 结构 年份 | 2008 | 0.102 | 0.061 | 0.022 |
| 2009 | 0.157 | 0.063 | 0.059 | |
| 2011 | 0.123 | 0.074 | 0.029 | |
斜压结构的2005年,2006年,2007年和2013年,各模态贡献有显著差异。2006年和2007年第一斜压模态最大(0.051m/s和0.028m/s),强于正压模态和第二斜压模态。2005年和2013年正压模态大于第一斜压模态,但是相差很小(2005年相差0.004m/s,2013年相差0.005m/s),所以这两年是由正压模态和第一斜压模态共同主导的。
通过图 4可以看出斜压结构的上层部分被第二斜压模态所显示,而中层部分是通过第一斜压模态显示的。所以当500m以下出现很强流速时,第二斜压模态便会占主导; 对于其它位置,中层流相对较弱,则第一斜压模态占主导。
整体而言,比较斜压模态与正压模态速率平均值可以发现,斜压结构斜压性要强于准正压性。2005年和2013年属于斜压结构,但是其正压性仍然很强,此时断面受正压模态和第一斜压模态共同主导,斜压性大于准正压结构的只受正压模态主导情况,这两年属于正压成分很大斜压结构。
各模态体积输运垂向分布表明(图 5),正压模态反映了各年体积输运的平均值,斜压模态反映了流场的垂向变化。对于2005年,2007年和2011年体积输运一致向西(图 3b),第二斜压模态几乎为零,整体的体积输运分布基本由正压模态和第一斜压模态所表征。而对于体积输运在垂向上出现方向变化的2006、2008、2009和2013年,体积输运主要由前三个模态共同贡献。
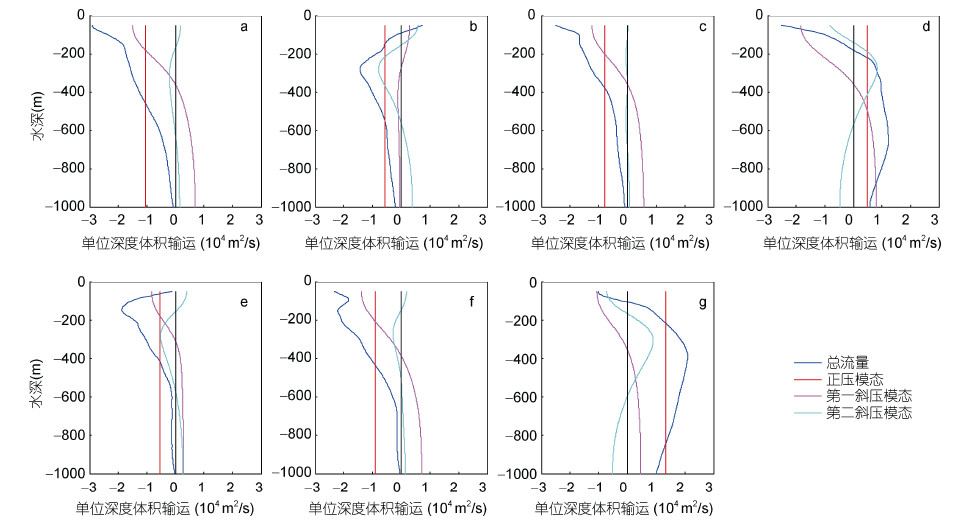 |
| 图 5 各模态的体积输运垂向分布 a、b、c、d、e、f、g分别表示2005—2009,2011和2013年 Fig. 5 The vertical structure of volume transport of each mode a, b, c, d, e, f, g represent the years of 2005, 2006, 2007, 2008, 2009, 2011, 2013, respectively |
本研究通过分析七年来的断面CTD资料,计算了120°E断面的流场结构,并对结构的正压斜压性进行了分析。本文取1500m作为“动力零面”深度,但因2007年断面20.6°N以南、2013年断面19.9°N以北和2009年站位的观测深度所限,这些年份相应站位“动力零面”被选定为1000m。研究表明,1000m以下体积输运除了2008年占总体积输运的17%以外,其它各年所占比例都小于8.5%,最小的2005年仅为0.3%。因而1000m以下的体积输运对总体积输运贡献较小,不影响本文的结论。
黑潮入侵南海的路径、方式和吕宋海峡大量的中尺度涡对吕宋海峡流场结构、水交换等皆有重要影响。120°E断面的交替东西向流,可能是黑潮入侵南海的体现,亦可能是南海内部涡旋、环流影响所致(Chen et al,2011c)。因而单个剖面观测到的东西向流,不能简单认为是西太和南海的水交换路径和流量。大面积水文观测、卫星观测资料和数模的结合应用,可以较好地阐明此科学问题。
4 结论基于CTD观测资料,本文研究了2005年至2013年(其中无2010年和2012年)7年120°E断面的流场结构和体积输运,得到以下结论:
(1)120°E断面流场结构存在显著的年际差异,其中2005年、2006年、2007年和2013年流场呈明显斜压结构,流速在深度上不仅存在大小变化,亦存在方向变换; 而2008年、2009年和2011年流场呈准正压结构,流速沿深度仅存在大小变化,没有方向改变。不同年份的体积输运随深度亦有显著差异,2005年、2007年和2011年,体积输运全水深皆向西; 2008年和2013年,体积输运表层向西、深层向东; 2006年和2009年,表层向东、深层向西。净体积输运大小存在很强的年际变化,西向最大为–11.2Sv,出现在2005年; 东向最大为9.1Sv,出现在2013年; 而2009年净体积输运仅为–1.2Sv。
(2)模态分解结果显示: 2006年和2007年断面的斜压性最强,最大模态为第一斜压模态; 2005年和2013年相对斜压性弱,整体由正压模态和第一斜压模态共同主导,最大模态为正压模态; 2008年、2009年和2011年正压性远大于斜压性。整体体积输运结果显示,对于总体积输运显正压的年份,体积输运通过正压模态和第一斜压模态两者主导; 对于总体积输运显斜压的分布方式,由于前三模态所占比例相差不大,所以是由三个模态共同主导。
| Centurioni L R, Niiler P P, Lee D K,.2004. Observations of inflow of Philippine Sea surface water into the South China Sea through the Luzon strait. Journal of Physical Oceanography, 34(1):113-121 |
| Chen G X, Hou Y J, Chu X Q,.2011a. Mesoscale eddies in the South China Sea:mean properties, spatiotemporal variability, and impact on thermohaline structure. Journal of Geophysical Research-Oceans, 116(C6), doi:10.1029/2010 JC006716 |
| Chen G X, Hu P, Hou Y J et al,.2011b. Intrusion of the Kuroshio into the South China Sea, in September 2008. Journal of Oceanography, 67(4):439-448 |
| Chen G X, Hou Y J, Chu X Q,.2011c. Water exchange and circulation structure near the Luzon Strait in early summer. Chinese Journal of Oceanology and Limnology, 29(2):470-481 |
| Chen G X, Xue H J,.2014. Westward intensification in marginal seas. Ocean Dynamics, 64(3):337-345 |
| Fang G H, Susanto D, Soesilo I et al,.2005. A note on the South China Sea shallow interocean circulation. Advances in Atmospheric Sciences, 22(6):946-954, doi:10.1007/BF02918693 |
| Gill A E,.1984. On the behavior of internal waves in the wakes of storms. Journal of Physical Oceanography, 14(7):1129-1151 |
| Hu J Y, Kawamura H, Hong H S et al,.2000. A review on the currents in the South China Sea:Seasonal circulation, South China Sea Warm Current and Kuroshio intrusion. J Oceanogr, 56(6):607-624 |
| Liang W D, Yang Y J, Tang T Y et al,.2008. Kuroshio in the Luzon Strait. Journal of Geophysical Research-Oceans, 113(C8):C08048, doi:10.1029/2007JC004609 |
| Nan F, Xue H J, Yu F,.2014. Kuroshio intrusion into the South China Sea:A review. Progress in Oceanography, 137:314-333, doi:10.1016/j.pocean.2014.05.012 |
| Nitani H,.1972. Beginning of the kuroshio. In:Stommel H, Yashida K eds. Kuroshio:Physical Aspects of the Japan Current. Seattle, USA:University of Washington Press, 129-163 |
| Qiu B, Lukas R,.1996. Seasonal and interannual variability of the North Equatorial Current, the Mindanao Current, and the Kuroshio along the Pacific western boundary. Journal of Geophysical Research-Oceans, 101(C5):12315-12330, doi:10.1029/95JC03204 |
| Qu T D,.2000. Upper-layer circulation in the South China Sea. Journal of Physical Oceanography, 30(6):1450-1460 |
| Qu T D, Girton J B, Whitehead J A,.2006. Deepwater overflow through Luzon Strait. Journal of Geophysical Research-Oceans, 111(C1):C01002, doi:10.1029/2005JC003139 |
| Qu T D, Kim Y Y, Yaremchuk M et al,.2004. Can Luzon Strait transport play a role in conveying the impact of ENSO to the South China Sea?Journal of Climate, 17(18):3644-3657 |
| Rong Z R, Liu Y G, Zong H B et al,.2007. Interannual sea level variability in the South China Sea and its response to ENSO. Global and Planetary Change, 55(4):257-272 |
| Su Y Q, Xue H J, Wang D X et al,.2014. Meridional overturning circulation in the South China Sea envisioned from the high-resolution global reanalysis data GLBa0.08. Journal of Geophysical Research-Oceans, 119(5):3012-3028, doi:10.1002/2013JC009583 |
| Tian J W, Yang Q X, Liang X F et al,.2006. Observation of Luzon Strait transport. Geophysical Research Letters, 33(19):L19607, doi:10.1029/2006GL026272 |
| Wyrtki K,.1961. Scientific Results of marine investigations of the South China Sea and the Gulf of Thailand 1959-1961. NAGA Report, Vol. 2, San Diego, USA:University of California, 164-169 |
| Yang Q X, Tian J W, Zhao W,.2010. Observation of Luzon Strait transport in summer 2007. Deep Sea Research Part I, 57(5):670-676, doi:10.1016/j.dsr.2010.02.004 |
| Yaremchuk M, McCreary Jr J, Yu Z J et al,.2009. The South China Sea through flow retrieved from climatological data. Journal of Physical Oceanography, 39(3):753-767, doi:10.1175/2008JPO3955.1 |
| Yu K, Qu T D, Dong C M et al,.2015. Effect of subtropical mode water on the decadal variability of the subsurface transport through the Luzon Strait in the western Pacific Ocean. Journal of Geophysical Research-Oceans, 120(10), doi:10.1002/2015JC011016 |
| Yuan Y C, Liao G H, Yang C H,.2008. The Kuroshio near the Luzon Strait and circulation in the northern South China Sea during August and September 1994. Journal of Oceanography, 64(5):777-788, doi:10.1007/s10872-008-0065-6 |
| Yuan Y C, Liao G H, Yang C H,.2009. A diagnostic calculation of the circulation in the upper and middle layers of the Luzon Strait and the northern South China Sea during March 1992. Dynamics of Atmospheres and Oceans, 47(1-3):86-113, doi:10.1016/j.dynatmoce.2008.10.005 |
| Zeng L L, Wang Q, Xie Q et al,.2015. Hydrographic field investigations in the Northern South China Sea by open cruises during 2004-2013. Science Bulletin, 60(6):607-615 |
| Zhao W, Hou Y J, Qi P et al,.2009. The effects of monsoons and connectivity of South China Sea on the seasonal variations of water exchange in the Luzon Strait. Journal of Hydrodynamics, Series B, 21(2):264-270, doi:10.1016/S 1001-6058(08)60144-4 |
| Zhou H, Nan F, Shi M C et al,.2009. Characteristics of water exchange in the Luzon Strait during September 2006. Chinese Journal of Oceanology and Limnology, 27(3):650-657, doi:10.1007/s00343-009-9175-2 |
 2016, Vol. 47


